Consultant reviewing clipboard data while standing in a retail store aisle, associates blurred in motion behind
Live Diagnostic — Store #117
-14%
Shrink Rate
$2.1M
Labor Waste
1.9×
Turns Gap
Retail Operations Consultancy

Your Stores Have the Traffic.
We Find the Margin.

We walk the floor, read the labor model like a balance sheet, and rewire everything from planogram logic to POS workflow until four-wall contribution flips positive.

Diagnostic Framework
340+
Doors Optimized
18.4%
Avg. Comp Lift
22 yrs
Advising Retail Boards
Labor Optimization
Planogram Architecture
POS Workflow Engineering
Inventory Velocity
Shrink Reduction
Customer Conversion
Four-Wall Contribution
EBITDA Recovery
Loss Prevention Systems
Same-Store Sales Growth
Labor Optimization
Planogram Architecture
POS Workflow Engineering
Inventory Velocity
Shrink Reduction
Customer Conversion
Four-Wall Contribution
EBITDA Recovery
Loss Prevention Systems
Same-Store Sales Growth
Exhibit 01Labor Optimization

Your Payroll Is a Forecast. Treat It Like One.

Most regional chains run labor schedules built from last year's volume assumptions. We rebuild the model from transaction-level data — hour by hour, zone by zone — until scheduled hours track actual demand within 4%.

The result: no more phantom coverage during dead hours, no more understaffing at conversion peaks. Labor becomes a precision instrument instead of a fixed cost.

Retail manager reviewing labor scheduling spreadsheets at a store office desk
Before → After / Client Composite
Labor as % of Net Sales
32.1%
24.8%
Schedule Accuracy
61%
94%
Annualized Labor Savings
$0
$2.7M

Composite results across engagements 2021–2025. Individual store results vary based on baseline conditions.

Retail warehouse with organized inventory shelves and workers managing stock flow
Before → After / Client Composite
Inventory Turns (Annual)
3.1×
5.8×
Markdown Rate
18%
9%
In-Stock on A-SKUs
71%
96%

Composite results across engagements 2021–2025. Individual store results vary based on baseline conditions.

Exhibit 02Inventory Flow

Dead Stock Is a Policy Decision. Reverse It.

Inventory turns below 4× in specialty retail signal a planogram built for the buyer's ego, not the customer's path. We map traffic flow against sell-through velocity and reset every fixture until the math supports the margin.

Markdown cadence, replenishment triggers, and vendor return windows are restructured in the same engagement — so the fix holds past the first quarter.

Exhibit 03Customer Conversion Architecture

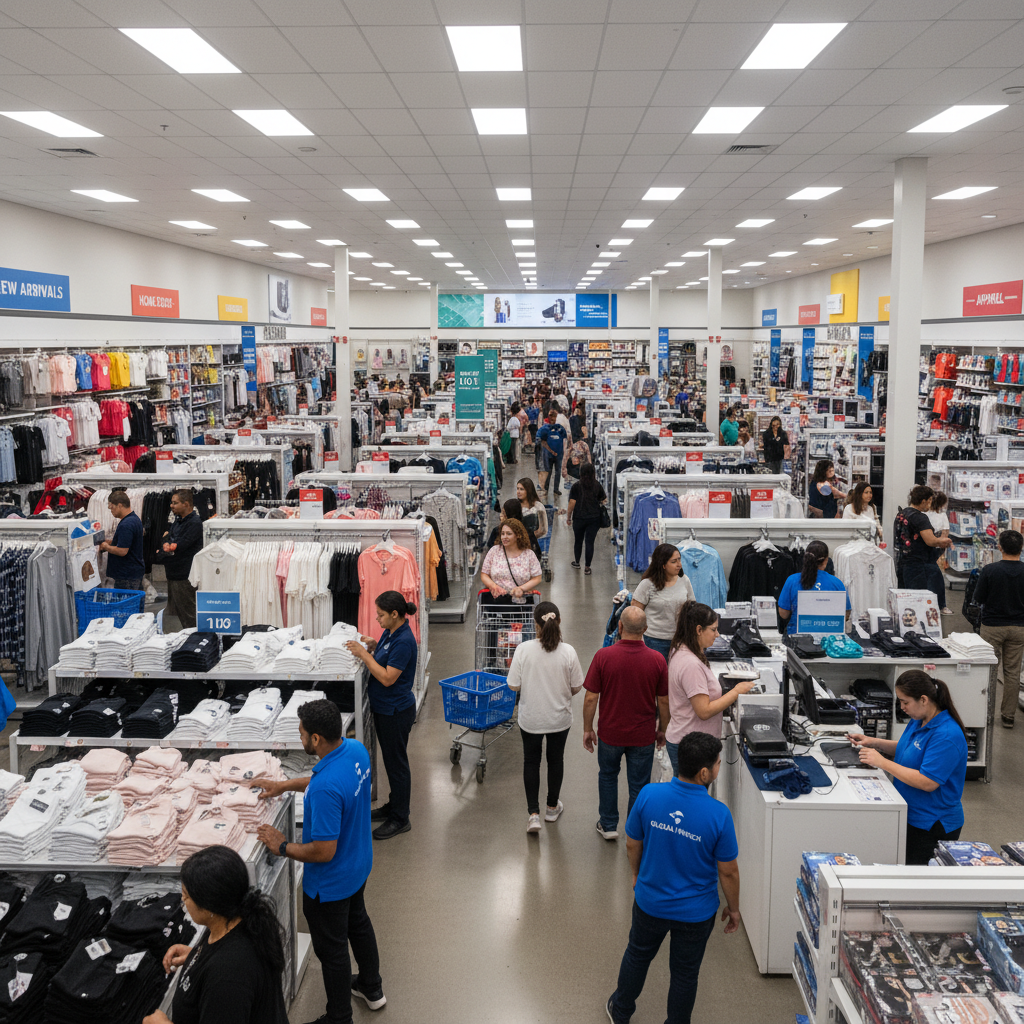
Traffic You're Paying For Is Leaving Without Buying.

A 200-door chain losing 3 conversion points against category average is leaving $14–22M on the floor annually. We audit the entire path — from parking lot to POS — and instrument every friction point.

Fixture adjacencies, associate intercept protocols, dressing room ratios, and checkout queue depth are rebuilt as a system, not treated as isolated variables.

Busy retail store with customers browsing merchandise and associates assisting shoppers
Before → After / Client Composite
Store Conversion Rate
19.2%
26.7%
Units Per Transaction
1.8
2.6
Revenue / Sq. Ft.
$187
$261

Composite results across engagements 2021–2025. Individual store results vary based on baseline conditions.

Security camera monitoring retail store floor with visible loss prevention signage
Before → After / Client Composite
Total Shrink Rate
3.8%
1.4%
Internal Shrink Share
58%
21%
Receiving Accuracy
82%
99.1%

Composite results across engagements 2021–2025. Individual store results vary based on baseline conditions.

Exhibit 04Loss Prevention Systems

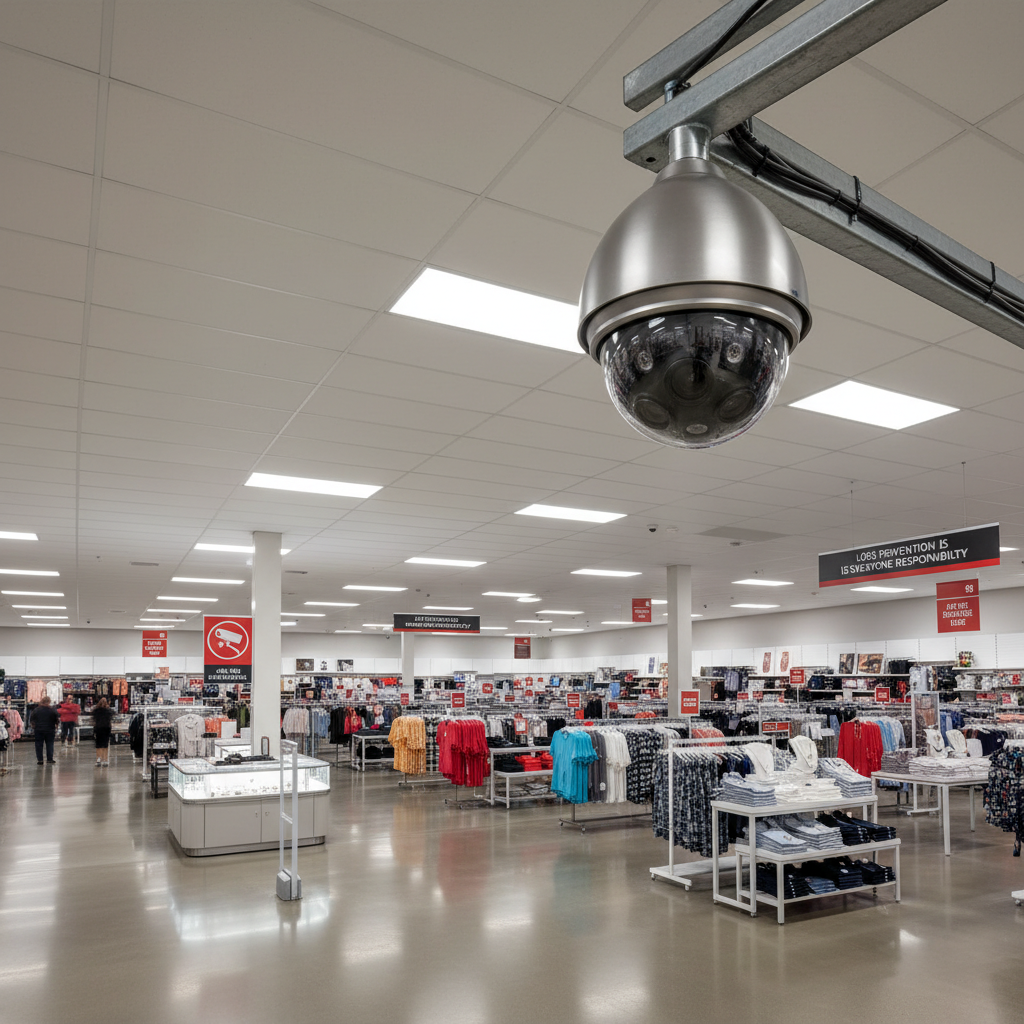
Shrink Is a Symptom. The Disease Is Process Failure.

External theft is visible. Internal shrink, receiving errors, and phantom inventory adjustments are not — and they typically account for 60% of total shrink in stores with no standard receiving protocol.

We install audit cadence, associate accountability frameworks, and POS exception reporting that surface the real number within 30 days. Then we fix the process that created it.

Client OutcomesSelected Engagements 2021–2025
Exhibit A
+22%
Regional Apparel Chain
84 doors

+22% four-wall contribution in 6 months

Exhibit B
$4.1M
Specialty Home Goods
210 doors

Labor model rebuilt; $4.1M annualized savings

Exhibit C
-38%
PE-Backed Footwear
47 doors

Shrink reduced 38% in 90-day sprint

Exhibit D
2.4×
Convenience & General Merch
320 doors

Inventory turns improved 2.4× post-planogram reset

Secondary Engagement Path

Not Ready to Call the Partners?

Download our Retail Ops Diagnostic Framework — the same 47-point assessment our partners run on Day One. It tells you exactly where your stores are bleeding margin and what to fix first.

Gated Download — Business Email Required

47-point assessment framework. No spam. Unsubscribe any time.